
Demystifying Information Technology
Sébastien Boivin CPA, CMA
Director, DECIMAL
It is no longer news that information technology (IT) costs are eating up an ever-increasing share of organizational budgets. And with good reason! Internal IT services are more vital and more complex than ever. Listen in on conversations about server sizing, web hosting infrastructure or cloud computing, and you may feel like you’re lout of your depht!
In this kind of context, Finance Managers struggle to safeguard their company’s financial health.
– How can IT costs be controlled when their cost behaviour is a mystery?
– How can a department’s performance be managed when its principles and components are expressed in an unknown language?
In fact, the answer to both these questions is simple, and the answer lies in collaboration between these two very different skill centres. And, in order to collaborate, they must understand each other and speak the same language.
This article suggests a way to establish a common language between IT and the rest of the organization, making it possible to not just talk to IT, but also to talk about IT – and its value-added services – to your company’s internal clients.
Basic principles
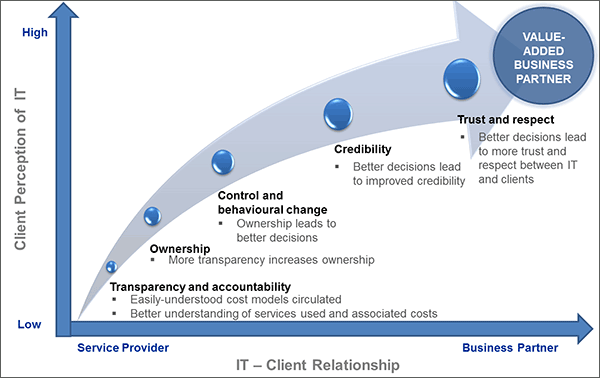
To lay the groundwork of this new communication with your IT services, and to help them become real business partners that bring real added value, simply follow the process (outlined below), much of which is based on management accounting principles:
- Transparency and accountability
- Use an activity-based costing model to establish a common language and circulate the resulting data;
- Ownership
- Sending IT Service Consumption Reports to internal clients in an easily-understandable language will lead to greater ownership of the data;
- Control and behavioural change
- Use activity-based management (ABM) to empower managers making them imputable of their specific IT usage;
- Establish policies and expectations designed to influence managers’ behaviour with respect to their internal IT service usage;
- Credibility
- Help IT use the momentum generated by ABM to make better decisions and, with time, to communicate better results;
- Generate usage and costing reports that show the impact of behavioural changes over time;
- Trust and respect
- Improved decisions by the IT department will bring them greater credibility; this means they will be included in more decisions and projects and provided with more information, thereby enabling them to more effectively manage their services;
- Value-added business partners
- IT views Finance as a trusted advisor and includes that department in its planning and decision-making processes;
- IT’s contribution is recognized and appreciated, leading to improved collaboration between the various departments.
What Is “IT” What Does It Do?
Transparency and accountability
The first phrase of the process involves establishing a language by which IT can communicate with the rest of the organization. This can be done by setting up an easily-understood cost model enabling IT to explain the costs (and breakdown of those costs) of internal client deliverables.
Once the model has been implemented, the results must be circulated and employee questions must be answered. This is the best way to tackle the lack of understanding around IT costs and deliverables.
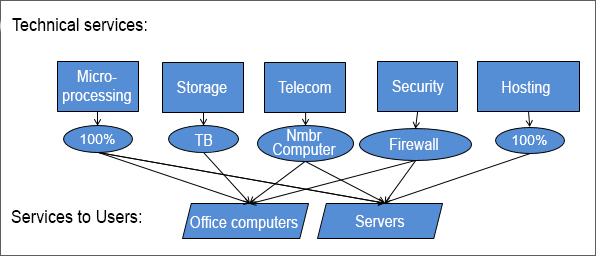
Implementing activity-based accounting means adhering to a number of basic principles, but the most important one for IT models is isolating and explaining the difference between technical services (those provided by IT) and user services (those used by internal clients). All too often, employees make unflattering comments about internal IT service costs. In fact, a cost of $2,000 per computer seems quite high when you consider that you could buy an equivalent computer for $1,250 at any retail outlet.
However, once it has been shown and methodically proven that, unlike computers for sale in the store, the $2,000 computer is supported, integrated into a network, equipped with corporate licences and, what’s more, is kept secure – then the price difference is justified and a common understanding of internal IT services is established.
The following chart breaks down services to users into their component parts in order to show what is included in the cost of a server or office computer.
Sample IT Cost Model Breakdown:
You can read an article that goes into greater detail on this topic here.
Ownership
The next step is to generate a report of internal IT service usage, based on activity-based cost modelling data. Similar to an invoice showing cost per unit, these reports will be distributed to IT service users.
To explain the value that IT services bring to each stakeholder in an organization, it is important to frame the information in easily-understood terms, so managers can see the impact of their team’s activities on IT costs. Once they have grasped that impact, it will be that much easier to persuade managers to reduce their usage.
The other part of the equation is getting people to understand the full range of IT services provided to the organization, and to hammer home the fact that IT has a limited capacity to meet needs and deliver services. All too often, IT is considered capable of delivering an endless supply of on-demand services, many of which have no significant impact on financial or organizational performance. The goal of presenting the range of IT services is to emphasize their limited capacity to supply the services in question, thereby enabling managers to put the services they use into perspective and hence to grasp the impact their usage has on the organization’s bottom line.
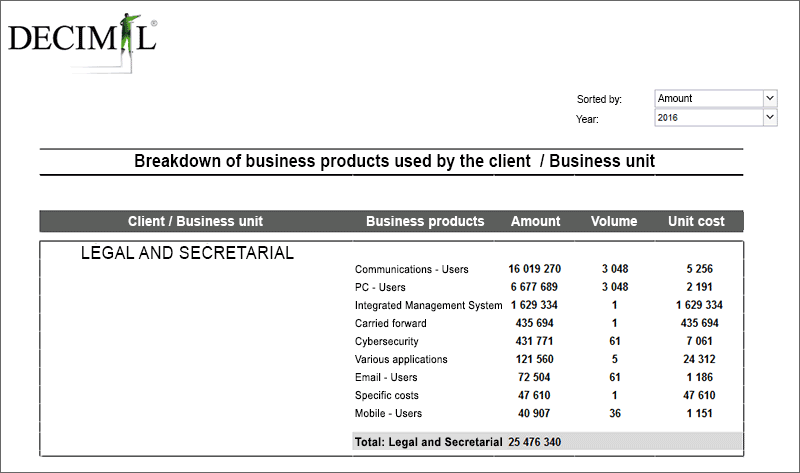
To maximize the impact of this usage report, it is vital that it be written in easily-understood terms. If you want managers to grasp the connection between their actions and their use of IT services, the terms – and, specifically, the units of measurement – must be clear. Highly technical units of measurement (MIPS, server components (MHz, cores), number of jobs generated, etc.), will only confuse managers and prevent them from making informed decisions about how to reduce their use. However, if the report uses more comprehensible units (number of computers, number of small / medium / large servers, terabytes allocated, etc.), managers will see the connection and take the necessary steps to reduce their use of IT services.
Sample Usage Report for Managers:
Control and behavioural change
When managers receive an IT services usage report showing Units Used x Unit Cost, obviously they have no control over the Unit Cost part of the equation. However, they can and must do something about the Units Used. Any manager with a 10-person team who receives a usage report showing 13 computers has an obligation to look into those excess units.
Is the team supposed to have three additional computers or should they be returned to IT? Since the cost per unit is spelled out in the usage report, the manager can easily see the financial impact of their decision: for instance, returning 3 computers at $2,000 each = $6,000. However, it is unlikely that the savings will have any significant impact for the organization, at least in the short term – unless, that is, the company has no computers on hand and must urgently buy three new ones to meet additional needs. The real impact of the managers’ decision is that it gives IT some wiggle room to meet future needs and delay any new computer purchases.
The report also enables the organization to impose limits on IT service use, to monitor and measure the impact of those limits. For example, if the IT manager mentions that the organization is running out of network space, the organization could implement a policy asking employees to refrain from storing downloaded music or private photos on company computers. The managers of the organization can then observe the change in storage over time and put the necessary measures in place to achieve their desired decrease in usage.
Credibility
When IT usage numbers have been circulated and read, IT has the perfect tool with which to establish its credibility throughout the organization. As previously mentioned, it is IT’s responsibility to control the Unit Cost part of the equation. If the unit cost gradually goes down, and the IT infrastructure performs well, employees will have no choice but to praise the IT managers’ good work.
Once the Control and behavioural change step is complete, an organizational shift with respect to internal use of IT services is already well under way. Even as managers are scaling back their use of IT services, IT must do their share to ensure active and effective management of their costs and capacity.
When determining the cost IT services, a not inconsiderable, often overlooked component is the cost of excess capacity.
To further illustrate this point, the following list gives some defining features of an IT infrastructure:
- High implementation cost;
- Relatively low maintenance cost compared to acquisition cost;
- Can be used in different ways: effectively or not; extensively or not at all;
- Its size depends on its ability to meet the highest peak in demand;
- Overall processing power for computers doubles every 2 years, so the technology you buy tomorrow will cost the same, yet be twice as powerful as what you buy today.i
Take a computer fleet, for example: its acquisition cost was high ($1,000 per computer); its maintenance cost is relatively low; the computers may be utilized (or not), effectively (or not); the number of computers purchased is based on the organization’s requirements during peak periods (i.e., if, because of the influx of interns, the number of employees goes from 30 to 40 in the summer, IT must purchase 40 computers to meet peak summer demand); and, finally, if the purchase can be delayed, computers purchased at the same price a year later will be much more efficient than those purchased today.
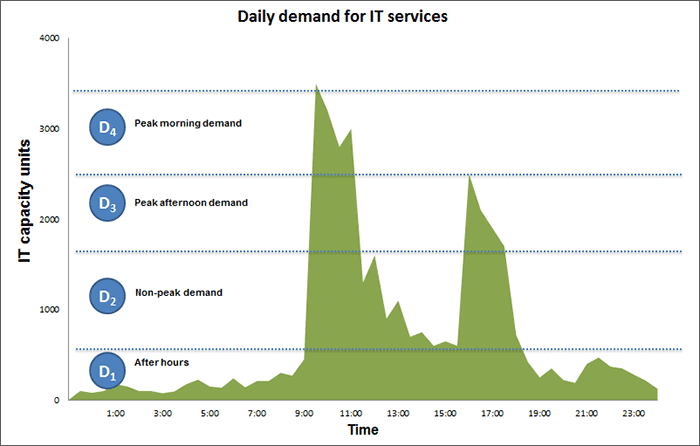
The graph below illustrates how capacity management can impact IT costs by showing daily peak usage times. To effectively meet the daily demand, the network must be capable of meeting peak need, indicated as level D4.
Determining infrastructure size requirements:
Once infrastructure size has been decided, the next step is to analyze the cost of services provided and to determine the cost of excess capacity, as illustrated by the following chart:
How to calculate the cost of excess capacity:
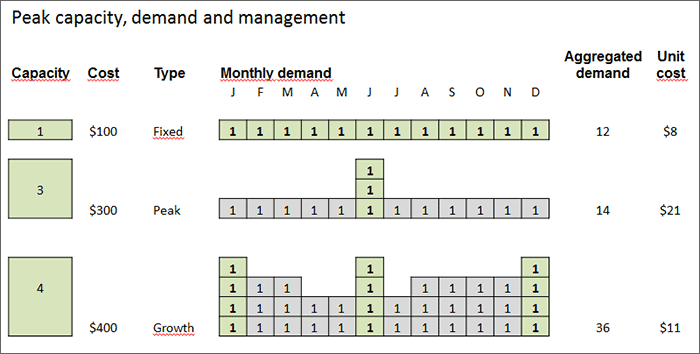
The above chart shows that the cost of excess capacity is $13, as the unit price goes from $8 for the first scenario (at full capacity) to $21 for the second scenario (with ineffective capacity management). That amount ($13 or $21 minus $8) is more than the cost of the service itself! The example clearly shows the importance of effective capacity management of IT services in order to achieve the lowest cost per unit possible and, in the process, improve IT’s credibility.
Once you have isolated the cost of excess capacity, the next question is: who will pay for it? If there is one department in particular that is responsible for the peak in demand, should it pay for the excess infrastructure related to that peak, or should the excess capacity cost be distributed evenly through a higher unit cost that everyone would pay? While the answer to that question will vary from one organization to another, it will certainly be easier to make that kind of decision once a common understanding of costs has been achieved.
Trust and respect
Between IT and the rest of the organization there now prevails an attitude of trust and respect. The veil of mystery surrounding IT activities, costs and the strategic and ever-present role they play has now been lifted. Managers have realized that their behavioural changes are shown in their internal usage report, and IT has demonstrated sound management of their costs and performance. As a result, IT becomes a trusted advisor that the organization is more likely to include in its decision-making processes.
Summary:
- There must be a common language enabling IT to communicate with the rest of the organization, leading to an improved understanding of IT activities;
- The whole organization knows what IT does and what it is capable of delivering;
- Managers know how their actions impact IT costs, and are careful to optimize their use of internal services;
- This gives IT managers more room to manoeuvre, in terms of both cost and capacity management, resulting in decreased IT costs and improved IT performance;
- The decreased IT costs attributed to managers’ actions gives the IT department greater credibility;
- This credibility translates into trust and respect for the work done by the organization’s IT department.
This is how IT becomes a value-added business partner within your organization!
iAdapted from Moore’s Law, named after Gordon Moore, Co-founder of Intel https://en.wikipedia.org/wiki/Moore%27s_law
Longueuil
- Head Office
- 793 Jean-Paul-Vincent Blvd. suite 100
Longueuil
(Quebec) Canada - J4G 1R3 - 1.450.640.1222
- info@decimal.ca
Quebec City
- 585 Charest Blvd. East suite 900
Quebec City
(Quebec) Canada - G1K 3J2 - 1.418.704.1222
- info@decimal.ca
![]()