
Does your dashboard provide an accurate picture of the situation?
DECIMAL Expert
How many times have you been told that your costs are accurate and precise?
Several years ago, I was asked to give conferences on BI (Business intelligence). Because of my focus on costing and profitability analysis, I found the topic extremely interesting. The question that immediately came to mind was: "Is your dashboard data truly reliable?" My primary objective in asking that question was to show, to what extent, poorly assessed costs can impact decision-making and, by extension, an organization’s profitability.
When giving these conferences, I often used the example of a dashboard that shows how you can, with the same data, generate divergent results. Imagine your dashboard displaying client profitability based on incorrect costs!
It is not uncommon for organizations to consider cost analysis as being a relatively unimportant part of their financial functions; the perception being that unit cost is fairly easily defined. Simply add together all the costs associated with a given product or service and then divide it by the total volume. Enter these numbers in an Excel spreadsheet and you’re good to go! The reality, of course, is quite different.
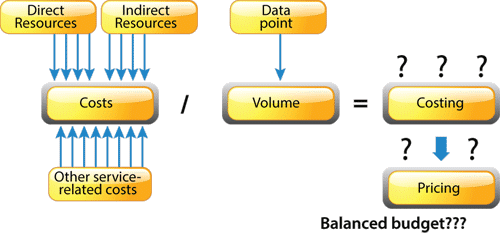
While it’s true that volume is fairly easy to find, the related resources are a whole other story. The following diagram shows how costing can be done. By looking at the possible variables, it’s easy to see that errors can occur, and thus, have a significant impact on the outcome.
An apparently simple calculation
To make my point, I have often said that some organizations could almost be sending out cheques to their clients along with their products!
Here’s a real-life example I encountered. A steel wire manufacturer started a new line of galvanized products. Manufacturing this new product required specific manufacturing procedures and components. As in many companies, the indirect costs associated with this new line were included in the manufacturing overhead. And, as it often happens, the portion of the costs associated with the new product line was underestimated, and those associated with the other products were overestimated. With such costing mistakes, imagine how wrong your forecast can be!
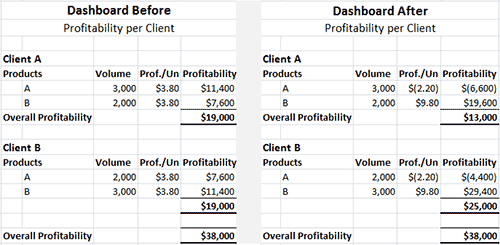
Let’s take a look at the following scenario: The left-hand table indicates that Client A and Client B are equally profitable. The right-hand table is based on the same information as the left one but the costing is now correctly calculated. Although the organization’s overall profitability remains unchanged, the right-hand table shows a considerable difference in profitability between the two clients.

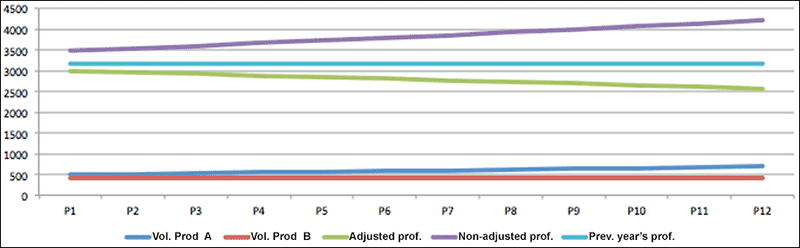
Let’s take a moment to make a projection based on the two different costing methods. The following graph shows the result of this projection.
The bottom lines represent the volume of the two products. The projection scenario shows a 3% growth per month for product A, while product B remains stable. The total volume increases by 11% over one year. The top three lines represent the profitability as per the two costing methods (adjusted and non-adjusted), and the previous year’s profitability, which was stable throughout the year.
If management continues using the previous costing method to make its projections, it would expect an 11% increase in profits. Actually, with the new costing method, they will end up with a 7% decrease in profits compared to the previous year, despite of an 11% increase in sales. The net result is an 18% variance in profitability! This information will obviously have quite an impact on the organization’s projections!
Here’s another example. A given company invested in new technology to increase the productivity of a specific line of products. Initially, all the overhead costs were allocated based on direct labour hours. Thanks to the new manufacturing technology, the direct labour used to manufacture the products was reduced by 75%. That’s great! However, there was one small problem: some of the new costs related to this investment – IT, specialized labour, specialized maintenance – were included in the overhead costs. Thus, the new product line benefitted from a triple advantage: increased performance reduced direct labour costs and finally, reduced indirect costs because the overhead cost were allocated based on direct labour hours.
Clearly, profitability analysis can be completely erroneous and lead companies to make wrong decisions. Have you ever been in a position where your sales are up but your profit margins are not?
Of course, our example with client A vs client B is simplistic. However, it provides a good idea of what it would be like to manage a large company supplying a lot more products and/or services. Even if you are told that your costs are accurate, how many of you lack reliable information to clearly understand why the overall profitability is eluding you?
Have fun in doing your assessments!
Profitability Optimization brochure
Longueuil
- Head Office
- 793 Jean-Paul-Vincent Blvd. suite 100
Longueuil
(Quebec) Canada - J4G 1R3 - 1.450.640.1222
- info@decimal.ca
Quebec City
- 585 Charest Blvd. East suite 900
Quebec City
(Quebec) Canada - G1K 3J2 - 1.418.704.1222
- info@decimal.ca
![]()